
Weekly Pulse: Supply Pressures and Liquidity Shape Gold and Silver Prices
Discover how the US dollar index and real-interest-rate changes shape weekly gold and silver moves. Get a tactical watch-list for traders.
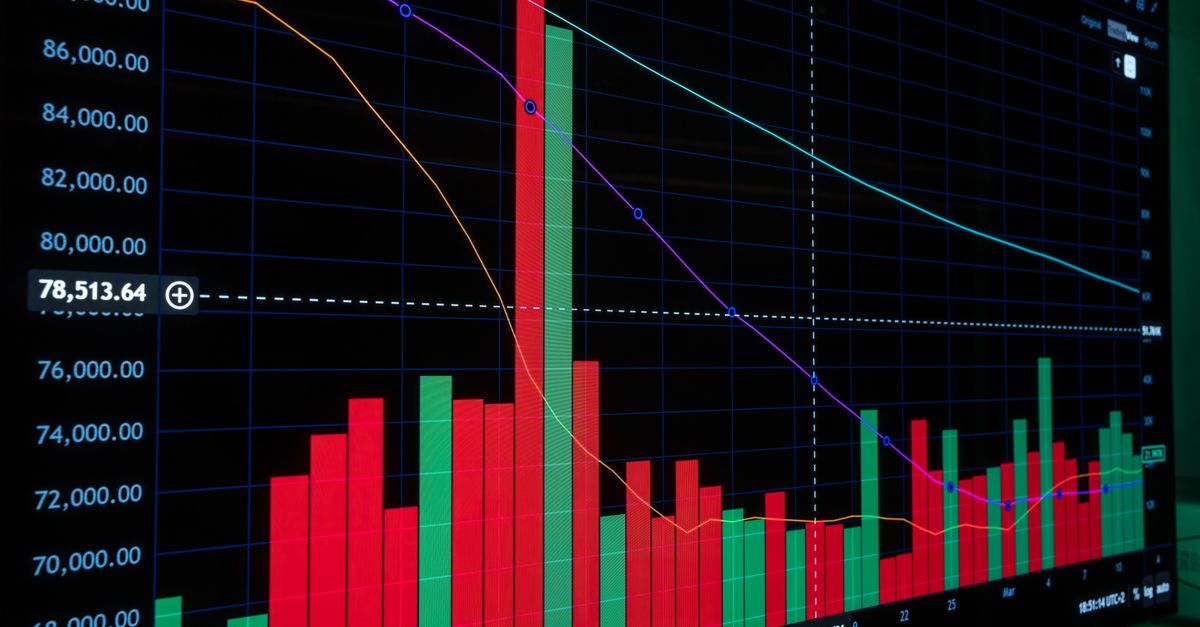
Introduction, Why a Weekly View Matters
Active traders and longer-term investors alike benefit from stepping back each week to see the bigger picture. Daily noise, a flash news story, a single economic release, or a brief rally, can obscure the forces that truly steer the market. By focusing on the week as a unit, you can spot whether price moves are driven by a shift in fundamentals, a technical trigger such as stop-loss clustering, or a change in market depth.
The commentary from Zero Hedge highlighted three inter-related themes that dominated the markets last week: supply pressures in bonds, energy and semiconductor chips; widespread stop-loss activity; and a thin “faux” liquidity environment. Understanding how each of these themes interacted with gold and silver can help investors gauge whether the recent price action is likely to repeat, reverse, or evolve into a new trend.
Live Prices (19 October 2026, 13:58 UTC)
- Gold: $4,155 per ounce (down 0.8 % vs the London afternoon fix)
- Silver: $57.32 per ounce (down 0.6 % vs the London afternoon fix)
- Platinum: $1,642 per ounce (up 0.1 % vs the London afternoon fix)
- Palladium: $1,125 per ounce (down 0.3 % vs the London afternoon fix)
These levels set the starting point for the analysis that follows.
What Drove the Market This Week?
1. Supply Pressures in Parallel Markets
The narrative around bond issuance, energy commodity availability, and the semiconductor chip supply chain created upward pressure on yields. Higher yields make non-yield-bearing assets such as gold relatively less attractive, because investors can obtain a higher return elsewhere without taking on metal-specific risk. In a similar vein, tighter energy supplies can lift inflation expectations, which often support gold as an inflation hedge.
2. Stop-Loss Activity Across Asset Classes
When price moves cross a pre-set threshold, many traders’ algorithms automatically sell (or buy) to limit further loss. A wave of such orders can amplify a move that originated from a relatively modest catalyst. The Zero Hedge piece notes that stop-loss clustering was evident “in every market everywhere,” suggesting that the gold and silver slides were at least partially mechanical, rather than pure reactions to macro data.
3. Thin or “Faux” Liquidity
Liquidity describes the ease with which an asset can be bought or sold without moving its price dramatically. Thin order books, where few limit orders sit on either side of the current price, mean that even modest trade sizes can generate outsized price swings. The term “faux liquidity” was used to describe a market that looks active on the surface (high volumes) but lacks depth behind the best bids and offers. In such an environment, gold and silver can experience sharper intraday swings, as seen in the recent modest declines.
4. Early-Week Credit-Market Signals
Credit-market warnings surfaced early in the week, pointing to potential stress in corporate debt markets. While the source does not link these signals directly to gold, a rise in perceived credit risk often triggers a flight to safety, which can lift gold demand. Conversely, if the perceived risk is modest, investors may stay in higher-yielding assets, exerting downward pressure on gold and silver.
Together, these four themes explain the modest declines in gold and silver without invoking the U.S. dollar index or real-rate movements, which are often cited but were not highlighted by the week’s narrative.
What This Means for Gold and Silver Investors
- Potential for continued volatility: The combination of stop-loss triggering and thin liquidity suggests that price swings may persist in the short term. Even a modest shift in bond yields or energy prices could produce a disproportionate move in metals.
- Risk-on vs. risk-off balance: Supply pressure on bonds pushes yields higher, encouraging risk-on positioning. If credit-market stress intensifies, the balance could tip toward risk-off, supporting gold as a safe haven. Monitoring which side dominates will be crucial.
- Indirect influence from related commodities: Energy and chip supply dynamics do not affect gold directly, but they shape the broader risk appetite and inflation outlook, both of which are key drivers for precious metals.
Understanding these indirect links helps investors avoid over-reacting to a single data point and instead view metal prices within the broader market ecosystem.
Background, The Themes in Context
Bond Supply and Yield Dynamics
When governments or corporations issue a large amount of debt, the added supply can push yields up, especially if demand does not keep pace. Higher yields raise the opportunity cost of holding gold, which yields no interest. Historically, periods of expanding bond issuance have coincided with pressure on gold prices, unless offset by strong inflation or crisis sentiment.
Energy Market Tightness
Energy commodities, such as oil and natural gas, influence inflation expectations because they affect production costs across the economy. A constrained energy supply can lift consumer prices, which in turn bolsters the case for gold as an inflation hedge. Conversely, ample energy supply can dampen price pressures and reduce gold’s appeal.
Semiconductor Chip Supply Chain
The chip sector is a bellwether for technology spending. Supply constraints can signal broader manufacturing slowdown, potentially leading investors to reduce exposure to risk assets and look toward safe-haven metals. On the flip side, a robust chip supply may signal strong economic momentum, encouraging risk-on allocations and putting downward pressure on gold.
Credit-Market Health
Credit markets reflect the willingness of lenders to extend financing to corporations. Early-week warnings of stress suggest that investors are paying attention to potential defaults or tightening financing conditions. A severe credit crunch often drives investors toward assets that preserve capital, such as gold, but the relationship is not linear and depends on the severity of the stress.
Definitions, Plain Language for Key Terms
- Real Interest Rate: The nominal interest rate adjusted for inflation. It represents the true cost of borrowing after removing the eroding effect of price rises. When real rates rise, holding non-yield-bearing assets like gold becomes less attractive.
- Yield: The return on a bond, expressed as a percentage of its price. Higher yields generally indicate higher borrowing costs and lower bond prices.
- Stop-Loss Order: A pre-set instruction to sell (or buy) a security once its price reaches a certain level, designed to limit potential loss.
- Liquidity: The ability to buy or sell an asset quickly without causing a significant price change. Thin liquidity means the market can move sharply with relatively small trades.
- Faux Liquidity: A situation where trading volume appears high, but there is little depth behind the best bid and ask prices, making the market vulnerable to rapid price swings.
- Credit-Market Warning: A signal, often from news headlines or analyst commentary, indicating rising risk in corporate debt markets, such as higher default rates or tighter financing conditions.
What to Watch Next
- Bond Issuance Activity: Keep an eye on announcements of new sovereign and corporate debt offerings. A surge in issuance could sustain upward pressure on yields, which would weigh on gold and silver.
- Energy Supply Reports: Monitor weekly reports on oil and gas inventories, production cuts, or geopolitical developments that could tighten or loosen energy supplies.
- Semiconductor Production Data: Weekly updates from major chip manufacturers can signal whether supply constraints are easing or worsening, influencing risk sentiment.
- Credit-Market Indicators: Watch for news on corporate default trends, loan-growth numbers, or central-bank commentary on credit conditions. Any escalation in perceived stress could shift investor appetite toward safe-haven assets.
- Liquidity Metrics on Exchanges: Observe order-book depth and trade-size distributions on the primary gold and silver exchanges. A return to deeper books would suggest a more stable price environment, while continued thinness could amplify volatility.
What We Don’t Know Yet
- Magnitude of Future Supply Shocks: While the current narrative points to supply pressures, the scale of upcoming bond issuances, energy shortages, or chip constraints remains uncertain. The exact impact on metal prices will depend on how large those shocks become.
- Timing of Credit-Market Stress Resolution: The early-week warnings hint at potential strain, but it is unclear whether the credit markets will stabilize quickly or deteriorate further, which would affect the risk-off/risk-on dynamic.
- Interaction with Global Currency Movements: The analysis deliberately set aside the role of the U.S. dollar index and real-rate shifts. How those factors will interplay with the supply and liquidity themes in the coming weeks is an open question.
- Investor Behavioral Responses: The extent to which stop-loss clustering will repeat depends on how many market participants have placed similar orders and whether algorithmic trading strategies will trigger again.
Practical Checklist for the Active Trader
- Map the Supply Narrative: Create a simple table tracking weekly bond issuance, energy inventory changes, and chip production updates. Look for patterns that coincide with metal price moves.
- Identify Stop-Loss Clusters: Scan intraday volume spikes and price jumps. If a spike coincides with a known technical level, it may be the result of stop-loss triggering.
- Gauge Liquidity Depth: Review the top ten levels of the order book on the main gold and silver exchanges. Thin depth suggests that a modest order could push price sharply.
- Monitor Credit Headlines: Set up alerts for news phrases such as “credit market stress” or “corporate default risk.” Use these cues to assess broader risk sentiment.
- Cross-Check Real-Rate Trends: Even though the week’s narrative did not emphasize real rates, maintaining a peripheral check on inflation-adjusted yields can add context to your metal view.
By integrating these steps, investors can move beyond reacting to price ticks and instead align their decisions with the underlying market forces.
Conclusion
The past week’s gold and silver price action reflects a confluence of supply-side pressure, mechanical stop-loss triggers, and a market environment where apparent liquidity may be misleading. For investors, the key takeaway is the heightened sensitivity of metals to shifts in bond yields, energy and chip supply dynamics, and credit-market sentiment. While the immediate price moves have been modest, the underlying factors suggest that volatility could remain a feature of the short-term outlook.
Staying alert to the upcoming issuance calendars, energy inventory reports, semiconductor production data, and credit-market warnings will help investors anticipate whether the current pressure will deepen, ease, or perhaps reverse. At the same time, acknowledging the unknowns, particularly the scale of future supply shocks and the ultimate path of credit stress, will keep expectations realistic and strategies flexible.