
Gold Trend Up as Sector Cycle Remains Down - Oct 17 2026 Update
Explore the Fed's 2027 rate outlook, real-rate dynamics, USD trends and their impact on gold price forecast 2026 for investors.
Overview
The latest market snapshot shows a mixed picture for the precious-metals world. While the broader gold sector cycle is described as “down,” the price direction for spot gold and for equities tied to the metal remains upward, and the U.S. dollar is posting strength. A recovery rally that had lifted prices earlier in the session was halted at a technical resistance level, and a correction is now in progress.
Gold traded at $4,166 per ounce on 17 October 2026, down 0.6 % versus the London afternoon fix.
Silver is at $57.00 per ounce, down 1.2 % versus the London afternoon fix.
Platinum is at $1,646 per ounce, up 0.3 % versus the London afternoon fix.
Palladium is at $1,112 per ounce, down 1.5 % versus the London afternoon fix.
These figures provide the latest benchmark for investors who track the metal’s day-to-day movements.
What the Development Means for Gold and Silver Investors
The juxtaposition of a down sector cycle with an up price trend creates a nuanced environment for investors. A “down” sector cycle normally signals that the overall health of the industry, measured by factors such as mining earnings, capital spending, and broader market sentiment, is weaker than usual. In that context, a rising spot price suggests that demand for gold as a store of value is outpacing the fundamental challenges facing miners and related companies.
For investors holding physical gold or spot exposure, the upward trend may support continued price appreciation in the short term, even as mining stocks could face pressure from the sector weakness. Conversely, the ongoing correction signals that the recent gains may be tempered, meaning that near-term price swings could be modest or even negative before the next leg of the trend resumes.
Silver, while not mentioned directly in the source, often moves in tandem with gold in risk-off scenarios. The same dynamics that are supporting gold’s price trend, strong dollar, safe-haven demand, and a technical bounce, can also lift silver, though the metal’s industrial component can add extra volatility.
Key Definitions
- Sector cycle: A broad view of the health of an industry, reflecting earnings outlook, capital investment, and market sentiment for companies within that sector. A “down” cycle indicates generally weaker fundamentals or investor confidence.
- Price trend: The direction in which the price of an asset is moving over a given period. An “up” trend means higher highs and higher lows, while a “down” trend means lower lows and lower highs.
- U.S. dollar strength: When the dollar gains value relative to other major currencies. A stronger dollar can make gold more expensive for holders of other currencies, but it also often coincides with higher safe-haven demand, which can support gold prices.
- Recovery rally: A short-term price increase that follows a decline, often driven by technical buying or a shift in sentiment.
- Resistance: A price level where selling pressure has historically been strong enough to halt upward moves. Breaking through resistance can signal a new leg of an uptrend, while a failure to break can trigger a pullback.
- Correction: A price decline of modest magnitude that follows a rally, typically viewed as a normal part of market cycles. Corrections can help reset overbought conditions and lay the groundwork for the next move.
Market Background
Gold’s price cycle is commonly described in four phases: accumulation, uptrend, distribution, and downtrend. The current description of the sector as “down” suggests the distribution phase may be influencing mining equities, even as the spot market remains in the accumulation or early uptrend stage. This divergence is not unusual; historical episodes have shown gold’s price decoupling from miner valuations when macro factors such as geopolitical tension, inflation expectations, or monetary policy dominate investor decisions.
The U.S. dollar’s recent strength adds another layer to the picture. A higher dollar can reduce the demand for gold among foreign buyers because the metal becomes more expensive in their local currency. However, when the dollar’s rise stems from safe-haven flows, often triggered by global uncertainty, the same investors may also be buying gold as a hedge, offsetting the currency effect.
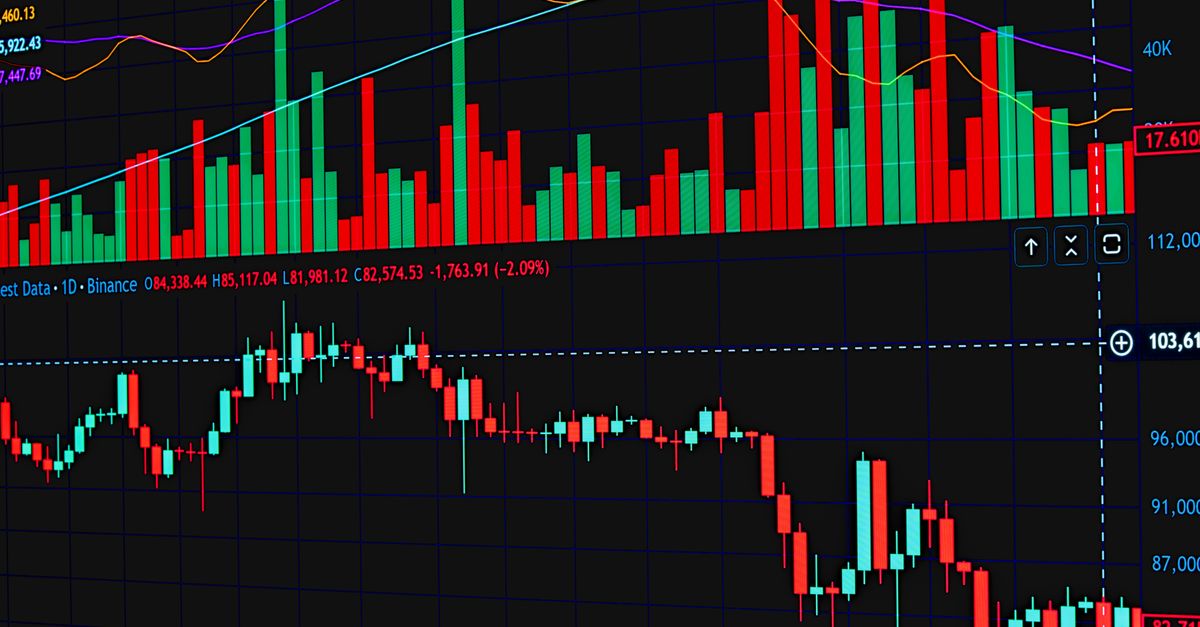
Technical analysis of the chart shows that the recovery rally encountered a resistance level that historically has acted as a ceiling for price moves. The failure to break through that level resulted in a correction, a pattern that traders watch closely because it can indicate whether the market will resume its uptrend or shift direction.
What to Watch Next
Investors should keep an eye on the following developments, described in general terms without invoking specific dates or numbers:
- Monetary-policy signals: Remarks from central-bank officials regarding interest-rate outlook can affect both the dollar and real yields, which in turn influence gold’s attractiveness.
- Inflation data: Trends in consumer-price measures are watched because higher inflation expectations tend to bolster gold’s safe-haven appeal.
- Geopolitical developments: Any escalation or de-escalation in major global tensions can shift risk sentiment and impact both the dollar and gold demand.
- Mining-sector earnings: Quarterly results from major gold producers can move the sector cycle further up or down, affecting the valuation of gold-related equities.
- Technical levels: Monitoring whether price breaks above the recent resistance or falls below a key support will help gauge the next direction of the trend.
What We Don’t Know Yet
The current snapshot leaves several questions open:
- The exact catalyst that halted the recovery rally and triggered the correction remains unidentified. Without knowing whether the move was driven by profit-taking, new supply data, or a shift in market sentiment, the strength of the correction is uncertain.
- The duration of the sector-down environment is unclear. If mining companies can improve earnings or if capital spending picks up, the sector could reverse, creating a more aligned environment for gold stocks and spot prices.
- The impact of the dollar’s strength on non-U.S. investors is not quantified. A stronger dollar could either suppress foreign demand for gold or reflect broader safe-haven buying that also supports gold.
- Potential policy changes that could affect real interest rates, such as adjustments to fiscal stimulus or tax policy, are not known, and those rates are a key driver of gold’s opportunity cost.
Answering these questions will require forthcoming data releases, corporate filings, and possibly new commentary from policy makers.
Summary for Investors
The key takeaway is that gold’s spot price is advancing while the broader mining sector remains under pressure, and the U.S. dollar is firm. This combination suggests that safe-haven demand may be outweighing the sector-specific headwinds for the time being. However, a technical correction after a stalled rally signals that short-term price moves could be constrained. Investors should monitor monetary-policy cues, inflation trends, geopolitical headlines, mining earnings, and key technical levels to gauge whether the uptrend will regain momentum or whether a deeper pullback could develop.
Source: Gold Eagle