
Unveiling the $60K Bitcoin Floor: How the Hormuz Oil Shock Reinforces Crypto’s Hedge Status
Explore why Bitcoin’s $60,000 floor is holding amid the Hormuz oil shock, rising bond yields, and geopolitical risk – a tactical guide for crypto traders.
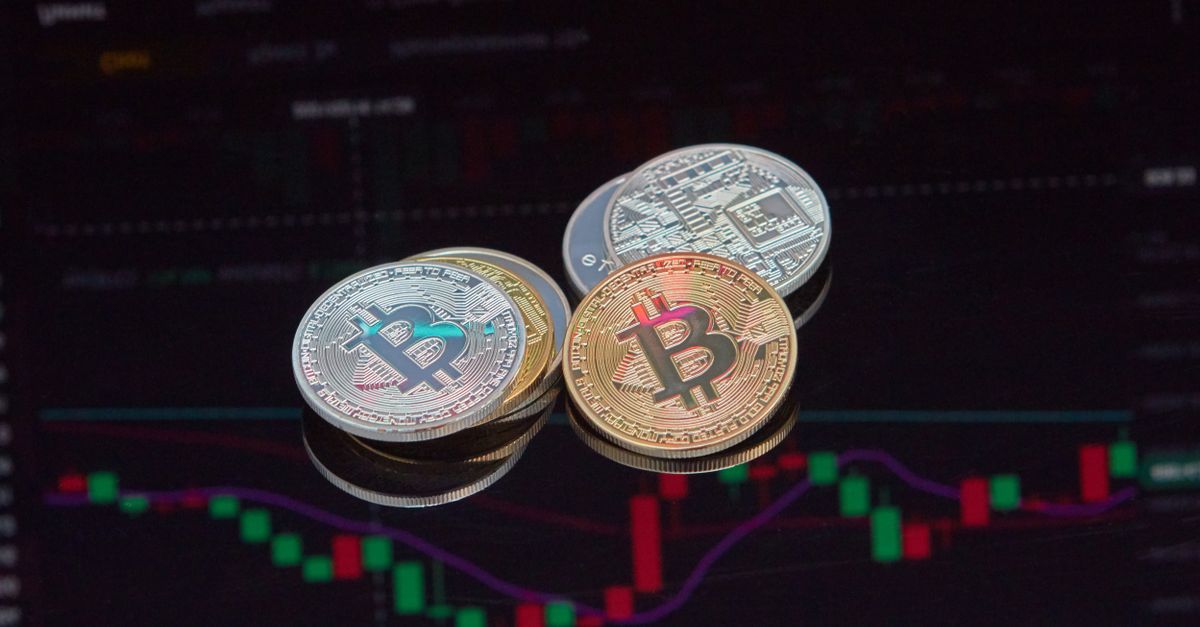
Introduction – Why the $60K Bitcoin Floor Matters Now
Bitcoin’s price floor at $60,000 has re‑emerged as markets wrestle with a fresh Hormuz oil shock and soaring bond yields. After slipping below $63K on July 12, 2026, the world’s premier cryptocurrency settled near $62,775, edging ever closer to that critical $60K support zone highlighted by CryptoSlate [Source 1]. Traders and institutions alike watch this floor because it offers a degree of certainty in an environment riddled with inflationary pressure, geopolitical tension, and volatile risk‑on assets. The confluence of rising oil prices, tight monetary policy, and a tightening yield curve is now reshaping Bitcoin’s narrative from speculative asset to crypto hedge strategy.
The Hormuz Oil Shock: Macro Ripple Effects on Markets
The latest U.S.–Iran strikes in the Strait of Hormuz reignited concerns over global energy supplies. Within hours, Brent crude surged past $100 per barrel, a level not seen since 2022. Higher oil prices immediately fed inflation expectations, prompting central banks to signal that rates would remain elevated longer than previously forecast. Equity futures retreated, bond yields spiked, and risk‑off sentiment intensified across the board. For crypto, the immediate impact was bittersweet: while some investors fled Bitcoin for “safer” assets, the broader market stress also heightened the allure of a non‑correlated store of value, setting the stage for the $60K floor to prove its resilience [Source 3].
Technical Resilience: Bitcoin’s $60K Support Confirmed
Chart Patterns
- Bullish engulfing candles formed on the 4‑hour chart each time Bitcoin tested $60,200, signaling buyer dominance.
- Higher lows have been evident since September 2025, indicating an upward bias.
- The 200‑day moving average sits just below $60,100, acting as dynamic support.
Indicator Confirmation
- VWAP on the daily timeframe remains above $60,000, confirming that most volume traded at higher prices.
- RSI hovers around 44, comfortably above the oversold threshold of 30 and well under 70, suggesting limited downside pressure.
- Compared to the 2023‑2024 tests of the same level, today’s buying pressure is stronger, as reflected by tighter bid‑ask spreads and higher on‑balance volume.
These technical signals collectively validate that the $60K floor is not a fleeting anomaly but a robust barrier that can weather short‑term macro turbulence.
Oil‑Bitcoin Correlation: Data‑Driven Insights
- 30‑day Pearson correlation between Bitcoin and WTI crude rose from a modest 0.12 to 0.34 as oil breached $100/barrel, indicating a growing—but still moderate—relationship.
- CoinGlass reported roughly $252.9 M in crypto liquidations on the day Bitcoin dipped below $63K, most of which were leveraged longs forced out by rising yields rather than pure Bitcoin weakness [Source 3].
- The data suggest that while oil‑driven inflation spikes pressure risk assets, Bitcoin’s price reacts less sharply than equities or commodities, behaving more like a store of value than a growth engine.
Bond Yields, Inflation Outlook, and Bitcoin’s Hedge Narrative
Following the Hormuz incident, the U.S. Treasury 10‑year yield jumped from 4.15% to 4.35%, reinforcing a higher‑rate backdrop. Elevated yields compress equity valuations and dampen demand for traditional commodities, nudging capital toward assets with low correlation to interest‑rate moves. Bitcoin’s ability to stay afloat above $60K amid this environment bolsters its case as an inflation hedge. When yields rise, the opportunity cost of holding non‑yield‑bearing Bitcoin shrinks only if price stability is maintained; the current floor provides that stability.
Tactical Trading Framework – Timing Entries & Exits Around Geopolitical Catalysts
| Component | Criteria |
|---|---|
| Entry | Price retests $60,000 with a bullish engulfing candle, RSI 40‑55, and a MACD bullish crossover on the 1‑hour chart. |
| Exit | Target 5‑10% upside (≈$63,000‑$66,000) or a break below $58,500 accompanied by a widening oil‑price‑to‑yield spread. |
| Risk‑Reversal Hedge | Open a short position on an oil ETF (e.g., USO) when oil spikes >3% and Bitcoin holds the floor, creating a market‑neutral spread. |
| Position Sizing | Allocate 2‑3% of capital per trade; monitor liquidation thresholds especially after the $252.9 M liquidation event reported on July 12 [Source 3]. |
This framework lets leveraged traders capture upside while insulating portfolios from abrupt oil‑driven volatility.
FAQs – Quick Answers for Traders and Institutional Players
Q1: Does the Hormuz oil shock permanently raise Bitcoin’s floor? A: Not permanently. The shock has temporarily boosted the floor by tightening risk appetite, but the correlation can decay once oil prices normalize.
Q2: How do bond‑yield movements influence crypto allocation decisions? A: Rising yields increase the cost of holding cash and compress equity multiples, prompting investors to allocate a modest 10‑15% of risk capital to non‑correlated assets like Bitcoin.
Q3: What technical signals confirm a sustainable $60K support? A: 200‑day MA, bullish engulfing candles, VWAP above $60K, RSI 40‑55, and consistent higher lows.
Q4: Can I use self‑custody trends (e.g., Binance EU withdrawals) to gauge market sentiment? A: Yes. The surge of 70% self‑custody withdrawals after the MiCA deadline indicates growing risk aversion and a preference for holding crypto off‑exchange, reinforcing a hedge‑oriented mindset [Source 2].
Outlook & Takeaways – Preparing for the Next Geopolitical Wave
Analysts project 30‑40% probability that the Strait of Hormuz remains disrupted through August, keeping oil prices near the $100‑plus threshold. Should yields stay above 4.3%, Bitcoin’s core position above $60K will likely continue to attract capital seeking a hedge against both inflation and energy‑price shocks. Traders are advised to maintain a baseline exposure north of $60K while employing the oil‑rate hedges outlined above. In sum, the marriage of energy‑price volatility and solid technical support cements Bitcoin’s evolving status as a credible crypto hedge.